WHITEBOXX / RESEARCH & ENGINEERING
Why a ticket join changed
the MRR calculation.
Using synthetic billing and support records, this example shows how a join turns a 10% MRR decline into an apparent 12% decline—and why ticket counts alone cannot explain churn.
Start with a revenue bridge that reconciles.
The example uses synthetic records for fixed contracted monthly recurring revenue in USD at 31 August and 30 September 2026. It excludes tax, usage charges, foreign exchange, recognised revenue and cash collection. No customer data or live Stripe/Zendesk extraction is used.
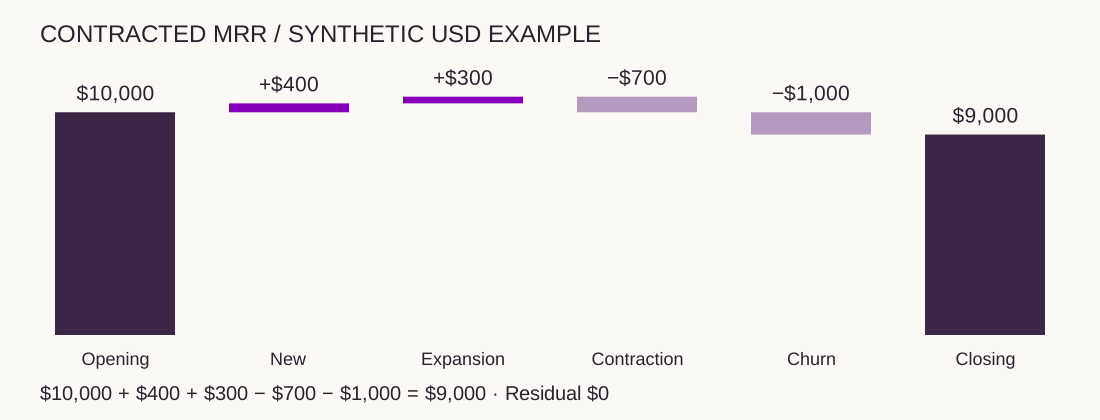
Opening MRR is $10,000 and closing MRR is $9,000. New business adds $400 and expansion adds $300. Contraction removes $700 and churn removes $1,000. Together, those movements explain the $1,000 decline with a zero residual. Calculations use integer cents before display.
WORKED EXAMPLE
A bridge that closes exactly.
SYNTHETIC EXAMPLE · USD CONTRACTED MRR · NOT A CUSTOMER RESULT
| Account | Opening MRR | Closing MRR | Movement | Tickets |
|---|---|---|---|---|
| Aster | $3,000 | $3,300 | +$300 | 3 |
| Birch | $2,000 | $2,000 | $0 | 0 |
| Cedar | $1,500 | $1,000 | −$500 | 3 |
| Delta | $1,200 | $1,000 | −$200 | 1 |
| Elm | $1,000 | $0 | −$1,000 | 2 |
| Fir | $800 | $800 | $0 | 0 |
| Grove | $500 | $500 | $0 | 0 |
| Hazel | $0 | $400 | +$400 | 0 |
$10,000 → $9,000
$20,000 → $17,600
Every movement reconciled
Net revenue retention: 86% = (opening + expansion − contraction − churn) / opening. Gross revenue retention: 83% = (opening − contraction − churn) / opening. New revenue is excluded from both numerators. These values use this example’s fixed contracted-MRR definition.
Joining raw tickets repeats account revenue.
The support table has one row per ticket, while the revenue snapshots have one row per account. Joining the raw tables repeats an account’s revenue for each ticket. In this example, the naive left join produces $20,000 at opening and $17,600 at closing, an apparent 12% decline.
Aggregate support records to one row per account before joining. Keep accounts with no tickets and include new accounts in the closing snapshot. The correct calculation remains a 10% decline.
Equal ticket counts accompany opposite revenue movements.
Aster and Cedar each have three tickets. Aster expands by $300; Cedar contracts by $500. That counterexample shows why ticket volume alone cannot explain the revenue movement.
Elm contributes the full $1,000 churn amount and has two onboarding tickets. Review the contract, onboarding history and customer conversation to investigate the cancellation. Those tickets are a starting point for a question, not evidence of its cause.
WORKING REFERENCE
What a Stripe and Zendesk project would need.
| Input | Implementation decision | Acceptance check |
|---|---|---|
| Billing state at both cutoffs | Define contracted MRR and the handling of discounts, cancellation timing and billing intervals. | A reproducible account-level snapshot that finance can reconcile. |
| Shared account identity | Map customer, organisation and subscription identifiers; isolate unmatched records. | No silent loss or multiplication of account revenue. |
| Support history | Define time window, ticket status and category treatment; aggregate before joining. | Account-level support measures retain the original ticket lineage. |
| Investigation workflow | Route relevant account movements with the source records and open questions. | A reviewer can distinguish the measured movement from the proposed explanation. |
Reproduce the diagnostic.
All account and ticket records are synthetic and included. The calculation reference explains the bridge, retention denominators and join treatment.
Opening records (CSV) ↗Closing records (CSV) ↗Support records (CSV) ↗Account bridge (CSV) ↗Full diagnostic (JSON) ↗Calculation reference (JavaScript) ↗