WHITEBOXX / RESEARCH & ENGINEERING
Market-entry research:
Germany, Netherlands and Poland.
Compare category imports, household spending and retail activity for 2024. The findings show why a country’s GDP growth is only one part of a market-entry investigation.
Begin with the product and the commercial decision.
An equipment supplier wants to choose where to investigate distributors next: Germany, the Netherlands or Poland. This example starts with HS 841869, a broad category for other refrigerating or freezing equipment. Its relevance still needs to be checked against the supplier’s actual products.
We compare 2023 and 2024 imports from the world, then add World Bank economic measures and Eurostat retail volume for a common year. The result helps define the next investigation; product fit, distributor margins and addressable demand need further evidence.
WORKED EXAMPLE
The common-year comparison.
Observation year: 2024 · Captured 20 October 2026 · World Bank, UN Comtrade and Eurostat
| Measure | Germany | Netherlands | Poland |
|---|---|---|---|
| HS 841869 gross imports (current USD) | $794,583,331 | $260,575,792 | $150,711,362 |
| Import value change, 2023–24 | -7.71% | -1.17% | -7.83% |
| Real GDP growth | -0.50% | +1.07% | +3.03% |
| Real household consumption growth | +0.53% | +1.13% | +3.00% |
| Household + NPISH spending (current USD) | $2,471.0bn | $528.5bn | $526.6bn |
| Retail volume change, 2023–24 (calendar adjusted) | +1.35% | +1.01% | -0.09% |
| Population | 83,516,593 | 17,993,485 | 36,559,233 |
Sources, scope and reproducibility
Fixed common-year comparison (2024), plus 2023 import comparison and calendar-adjusted retail volume indices. Rates calculated from unrounded values. No composite attractiveness score. No FX conversion across time or import-demand equivalence is assumed.
World-partner gross imports, current US dollars. Not final domestic sales, installed base, tariff advice or a market-size estimate. Quantities are not usable in the preview rows. Trade records use HS classification H6. Captured rows are aggregates with isReported=false; this example does not relabel them as directly reported records. Eurostat series sts_trtu_a uses G47, VOL_SLS, I21 and calendar adjustment CA.
- World Bank / World Development Indicators / wdi-population · captured 2026-10-20T13:20:25.371Z · publisher updated 2026-10-08
- World Bank / World Development Indicators / wdi-household_spend · captured 2026-10-20T13:20:25.821Z · publisher updated 2026-10-08
- World Bank / World Development Indicators / wdi-household_growth · captured 2026-10-20T13:20:26.282Z · publisher updated 2026-10-08
- World Bank / World Development Indicators / wdi-gdp_growth · captured 2026-10-20T13:20:27.148Z · publisher updated 2026-10-08
- World Bank / World Development Indicators / wdi-gdp_per_capita · captured 2026-10-20T13:20:28.208Z · publisher updated 2026-10-08
- World Bank / World Development Indicators / wdi-unemployment · captured 2026-10-20T13:20:29.759Z · publisher updated 2026-10-08
- Eurostat / retail-volume · captured 2026-10-20T13:16:42.461Z · publisher updated 2026-10-17T11:00:00+0200
- UN Comtrade / trade-DE-2023 · captured 2026-10-20T13:20:30.780Z
- UN Comtrade / trade-DE-2024 · captured 2026-10-20T13:22:43.582Z
- UN Comtrade / trade-NL-2023 · captured 2026-10-20T13:22:57.614Z
- UN Comtrade / trade-NL-2024 · captured 2026-10-20T13:23:12.862Z
- UN Comtrade / trade-PL-2023 · captured 2026-10-20T13:23:14.872Z
- UN Comtrade / trade-PL-2024 · captured 2026-10-20T13:23:29.188Z
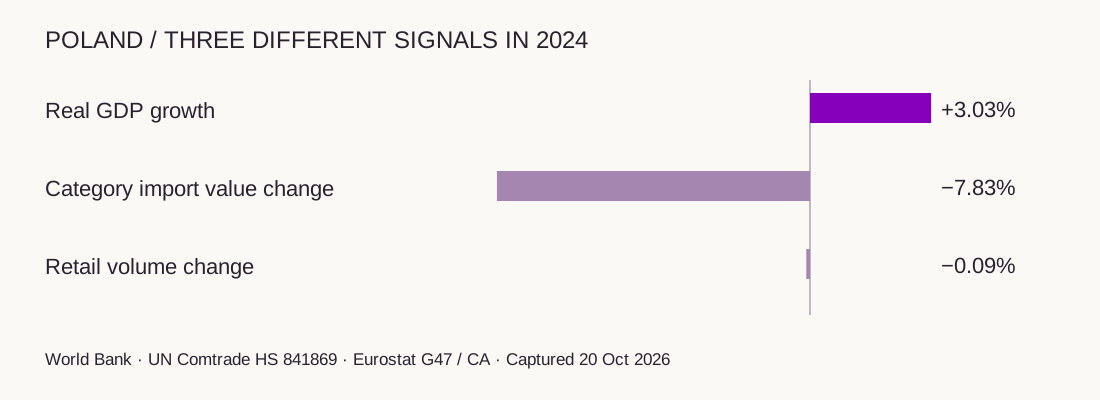
Poland’s economic growth and category imports tell different stories.
Poland’s real GDP grew about 3.03% in 2024 and household consumption grew about 3.00%. Imports in the selected equipment category fell about 7.83%, while broad retail volume was roughly flat. Selecting the fastest-growing economy would miss this difference.
Germany has the largest gross import flow in the comparison. The Netherlands has the highest imports per resident. To interpret those figures as a sales opportunity, investigate transit and re-exports, product mix, replacement cycles and the supplier’s channel economics.
Household spending and retail volume add economic context but do not directly measure demand for business refrigeration equipment. Changes in dollar import values can also reflect prices and exchange rates. The captured preview rows do not support unit-price calculations.
WORKING REFERENCE
Six areas to investigate before entering a market.
| Layer | Evidence needed | What is established here |
|---|---|---|
| Product definition | SKU, use case, HS classification and relevant exclusions. | A broad HS6 category; product-level fit remains open. |
| Category flows | Imports, origins, exports, quantity quality and period comparability. | World-partner gross imports for two years; quantity data is not usable. |
| End-market activity | Sector demand, installed base, investment and replacement cycles. | Macro and broad retail context only; no category sales forecast. |
| Channels and geography | Distributors, locations, service coverage and route-to-market. | Not measured in this example; a distinct next investigation. |
| Counterparties | Legal entities, trading names, financial records and ownership where available. | No distributor identity or credit assessment has been performed. |
| Commercial economics | Your landed costs, achievable prices, service burden and internal conversion data. | Requires first-party inputs; no margin or return estimate is claimed. |
The next research for this supplier.
Check the product classification, then examine import origins and exports to understand the category flows. Research a small set of named distributors and their service coverage. Bring in the supplier’s installed-base, pricing and win/loss records.
The next report should identify which markets and counterparties deserve further sales investigation, with the evidence and unanswered questions behind each choice.
Inspect all the figures.
Publisher precision, definitions, source URLs, capture dates and transformations are retained in the evidence pack. Observation year 2024 is a fixed comparison period, not the latest available year.
Country comparison (CSV) ↗Category imports (CSV) ↗Retail volume (CSV) ↗Economic series (CSV) ↗Methods & provenance (JSON) ↗The original economic comparison is still available.
The 18 October brief compared nine World Bank observations: GDP per capita, real GDP growth and unemployment for the same three countries in 2024. This expanded analysis adds trade, household spending and retail data. The original observations and capture history remain available below.